Connecting Members, Advancing Knowledge
We are your central source of information related to workers’ compensation in Canada.
Reach out to us
We are your central source of information related to workers’ compensation in Canada.
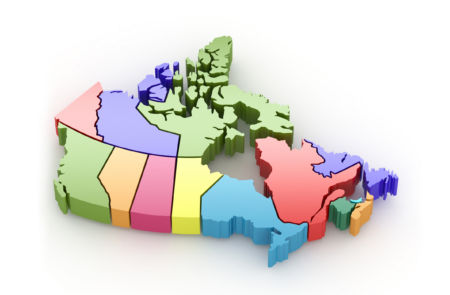
Reach out to usThe Association of Workers’ Compensation Boards of Canada (AWCBC) was founded in 1919 as a non-profit organization to facilitate the exchange of information between Workers’ Compensation Boards and Commissions across the country. Today, it has 12 Members representing each provincial/territorial jurisdiction responsible for administering workers’ compensation legislation in Canada. In addition to serving members, as the sole provider of national workplace injury statistics and creator of Key Statistical Measures, the Association also serves the Canadian public.
Discover more about AWCBCBrowse common questions and find quick answers in our FAQ section. Need more help? Contact us for assistance.
See all FAQsStay informed of the latest trends and emerging issues shaping workers’ compensation across Canada and beyond.


Acting as the national liaison connecting all 12 provincial and territorial member boards and commissions in Canada.
Expand your knowledge and expertise by exploring our collection of curated resources.
Go to the Knowledge CenterBelow you can find links to tables summarizing the Assessments & Premiums, Benefits, Rehabilitation and Return to Work programs, Legislation & Policy, and Who is Responsible for OH&S at each Workers’ Compensation Board / Commission in Canada. Click on the topic of interest to see the tables available for that subject.
See the Tables