Statistics
National Work Injury/Disease Statistics Program (NWISP)
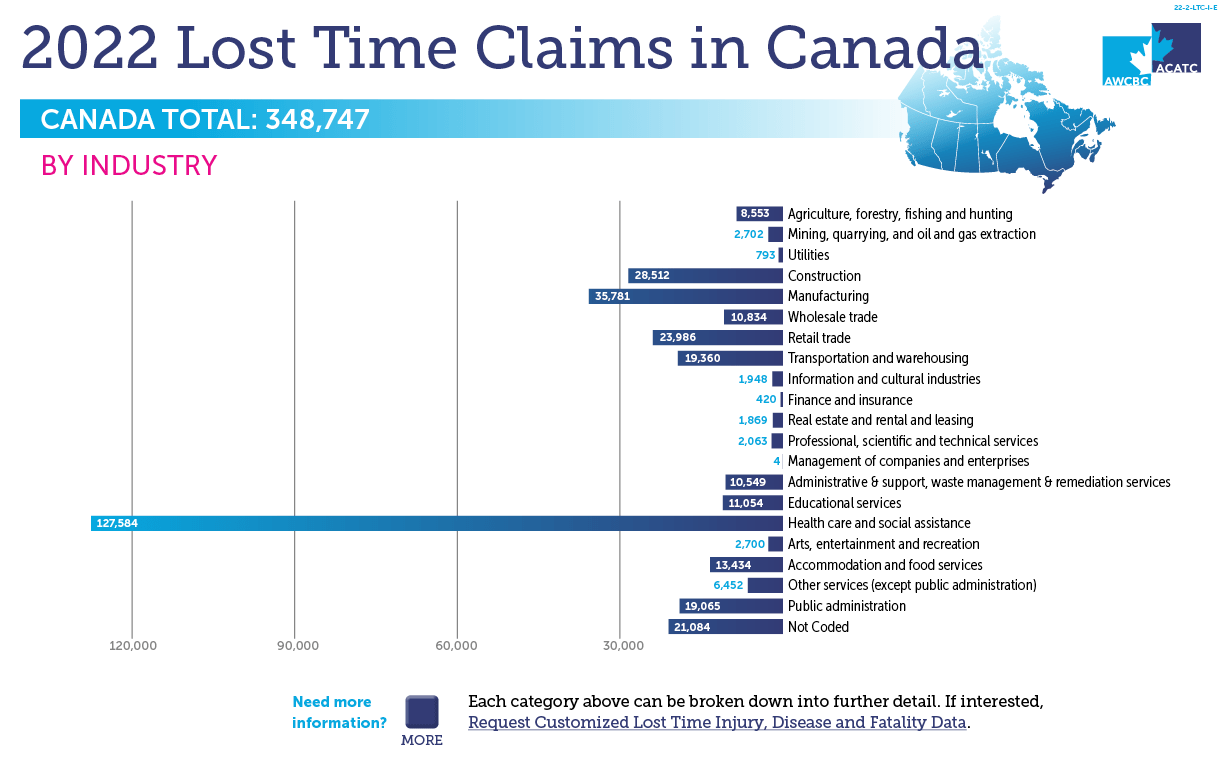
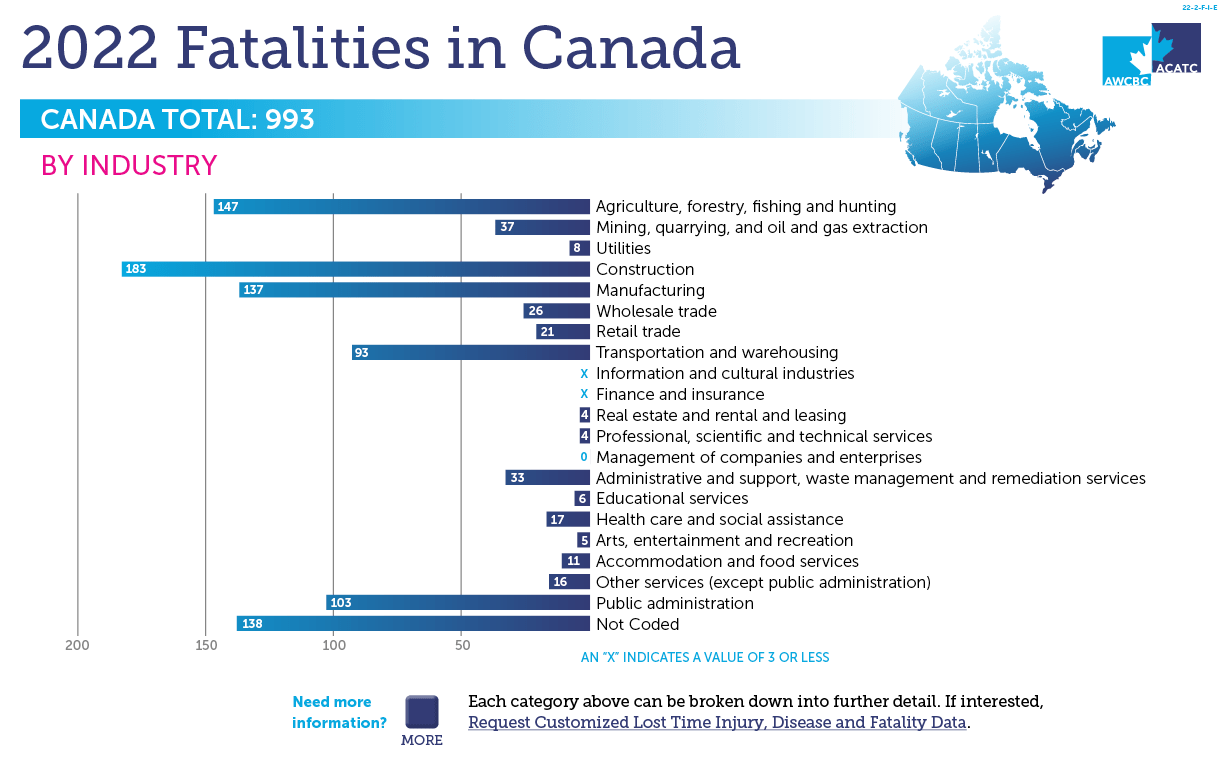
Data on work-related, accepted Lost Time Claims, Diseases and Fatalities across 20 major industrial groups and sorts it into 10 subset categories. For more information, view Fact Sheet and Resources
Download:
Lost Time Claims Data – 2022 | Fatalities Data – 2022| NWISP Publication | NWISP – Year At A Glance
*When you download, you agree to our Terms and Conditions
Request Customized Lost Time Injury, Disease and Fatality Data: Click Here
Click here for more Lost Time Claims, by Industry – Table #15 (pdf)
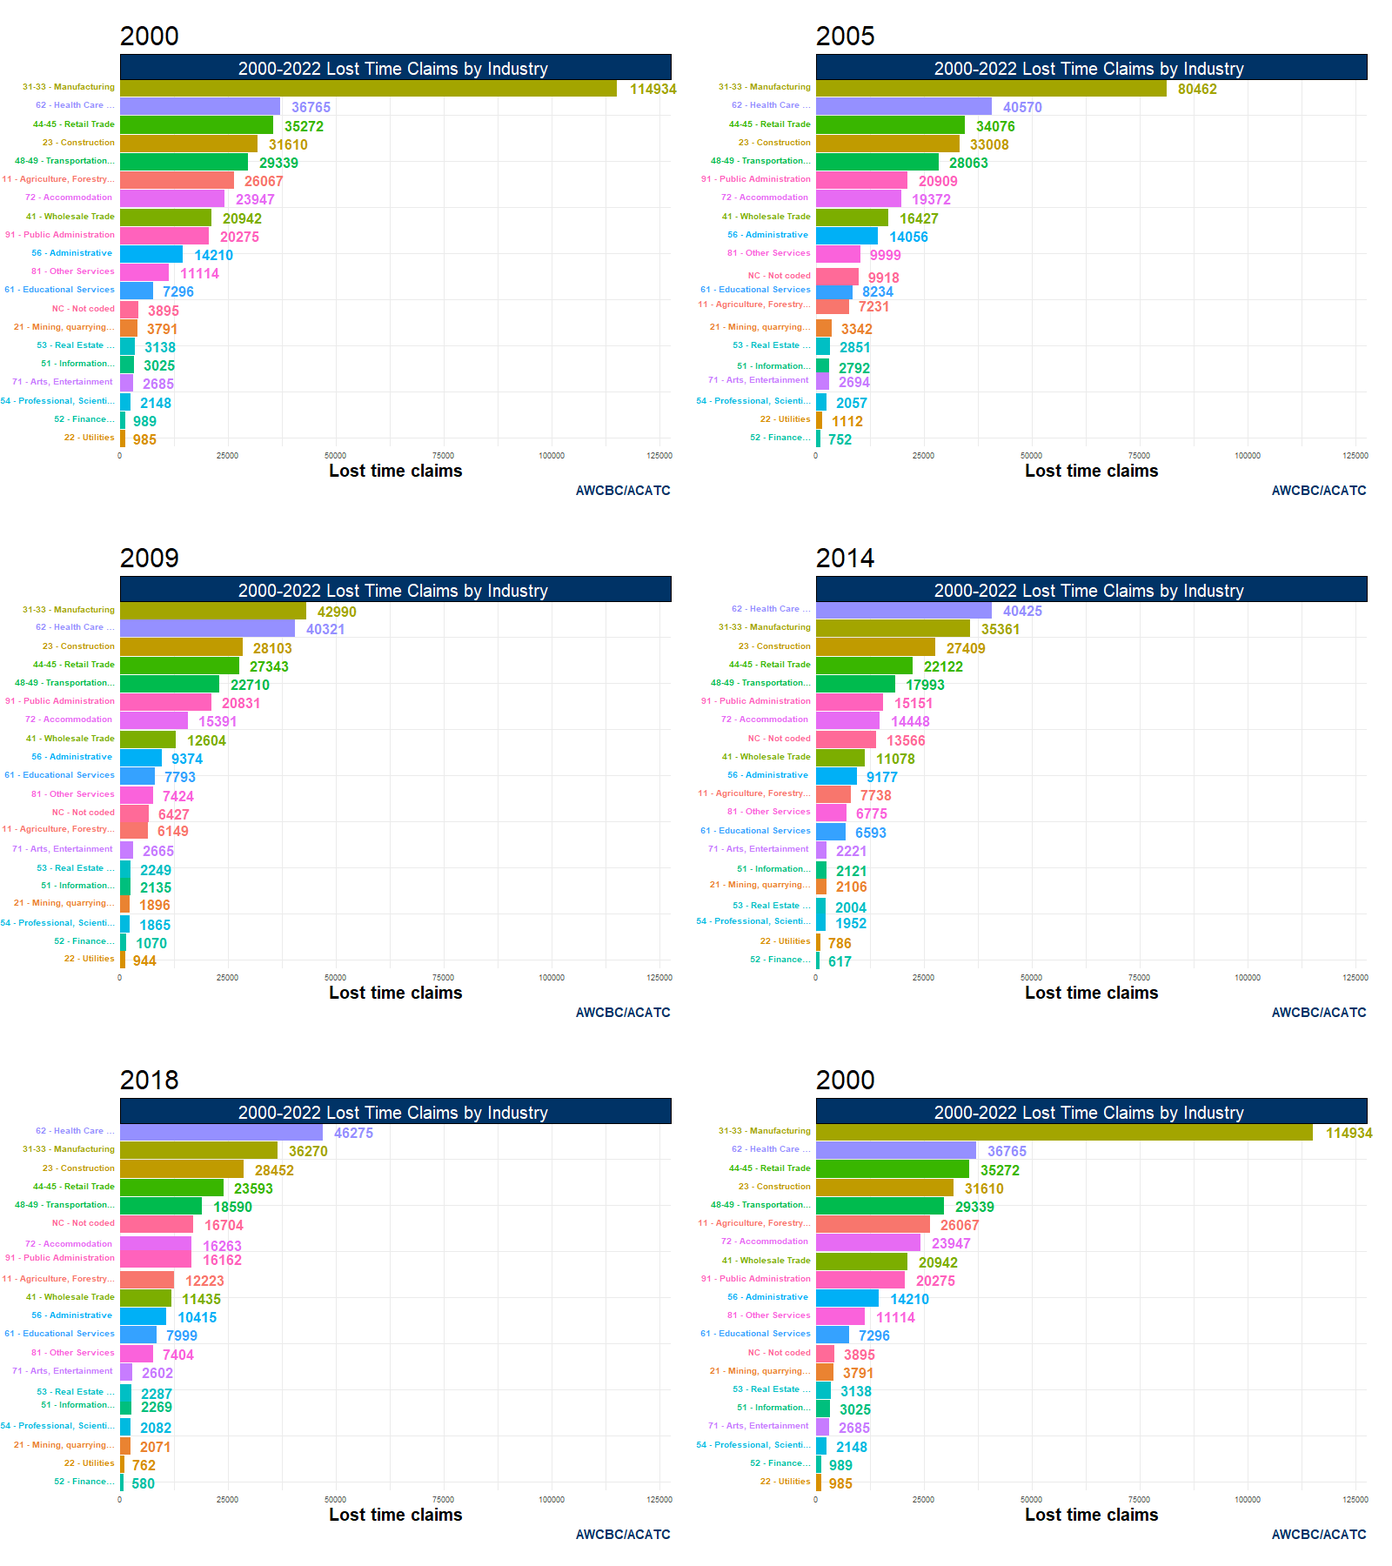
Lost Time Claims, by Industry – 2000 to 2022
Click here to download Lost Time Claims, by Industry – 2000 to 2022 Data (xls)
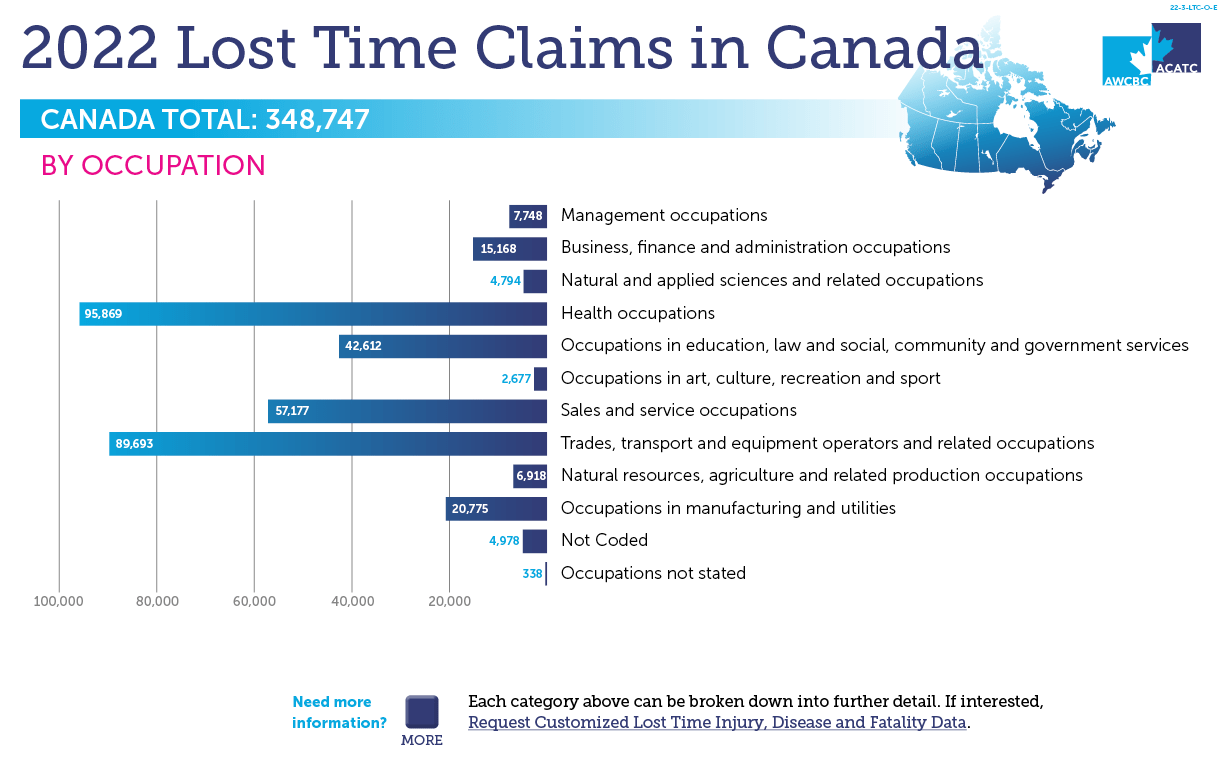 Click here for more Lost Time Claims, by Occupation – Table #8 (pdf)
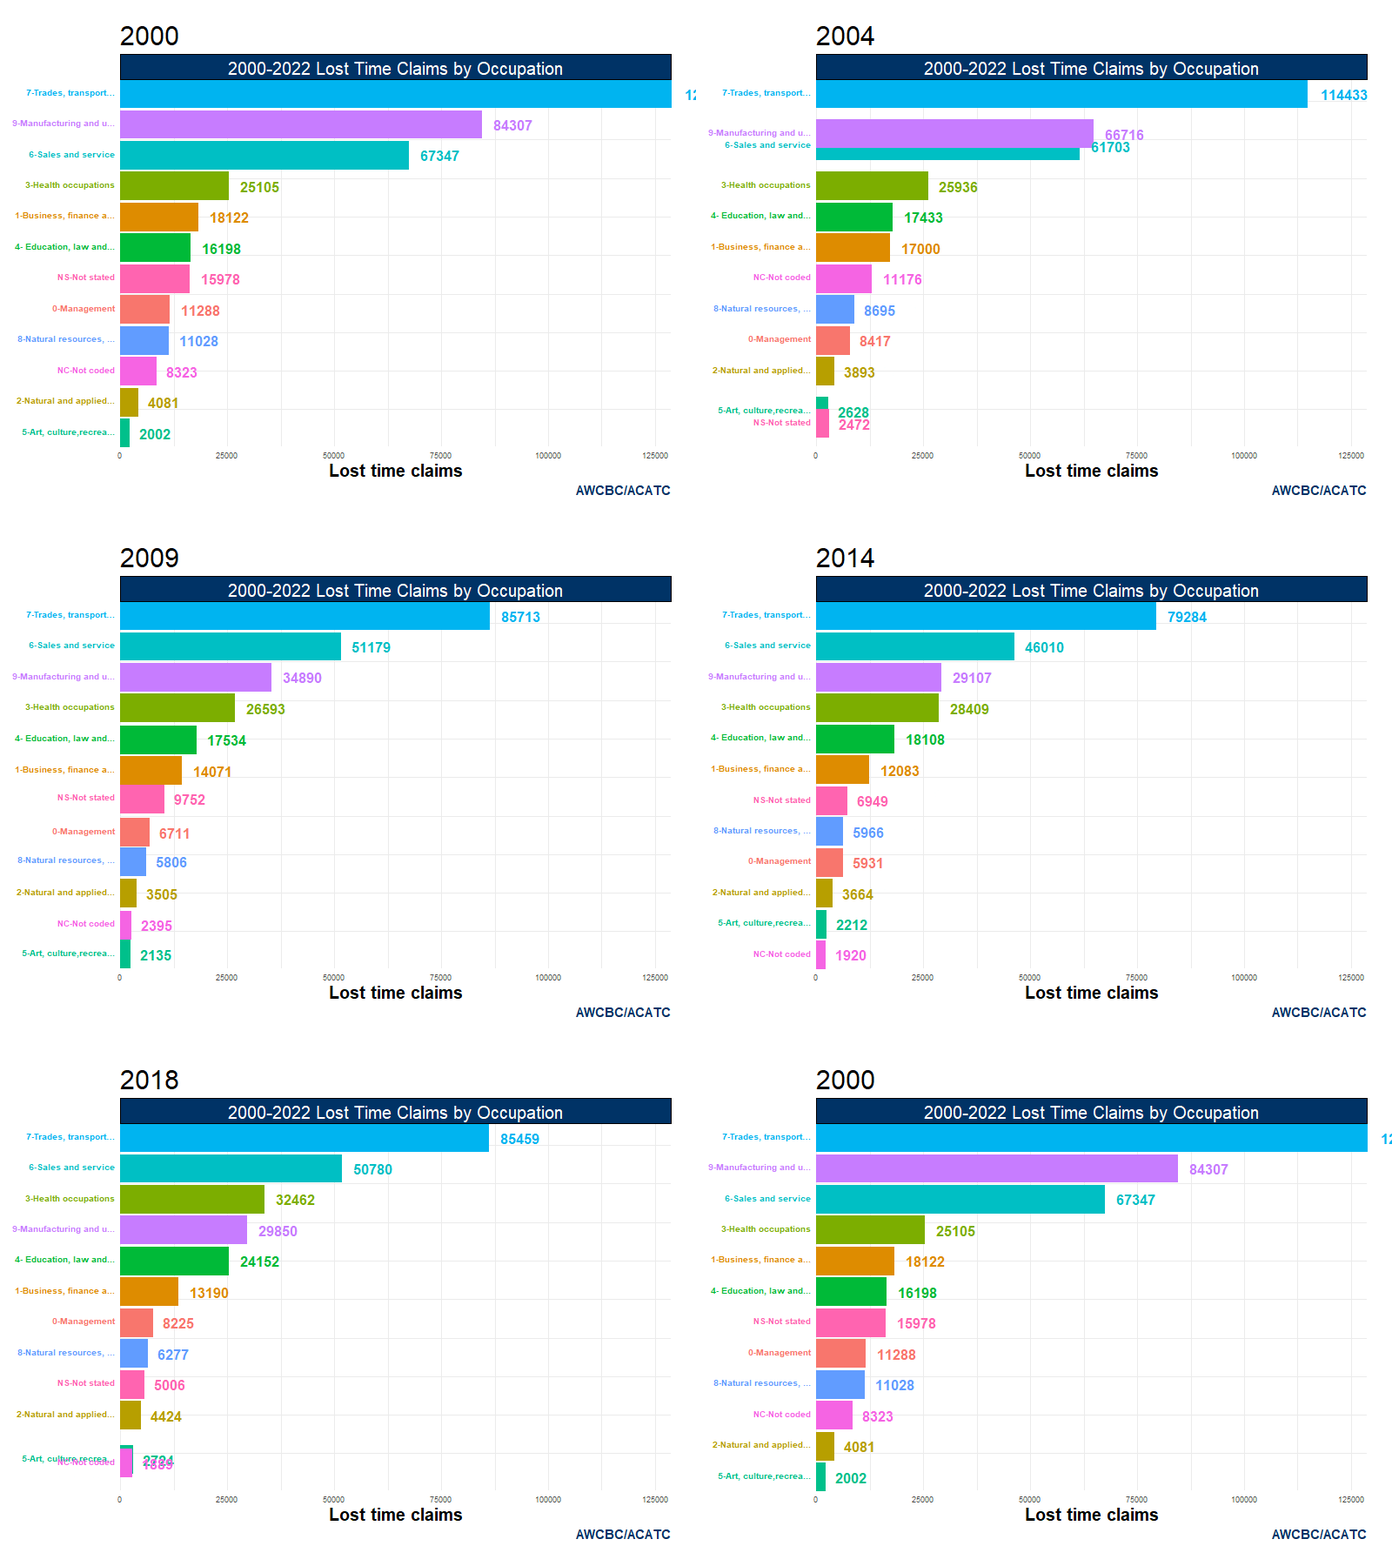
Lost Time Claims, by Occupation – 2000 to 2022
Click here to download Lost Time Claims, by Occupation – 2000 to 2022 Data (xls)
Click here for more Lost Time Claims, by Nature of Injury or Disease – Table #4 (pdf)
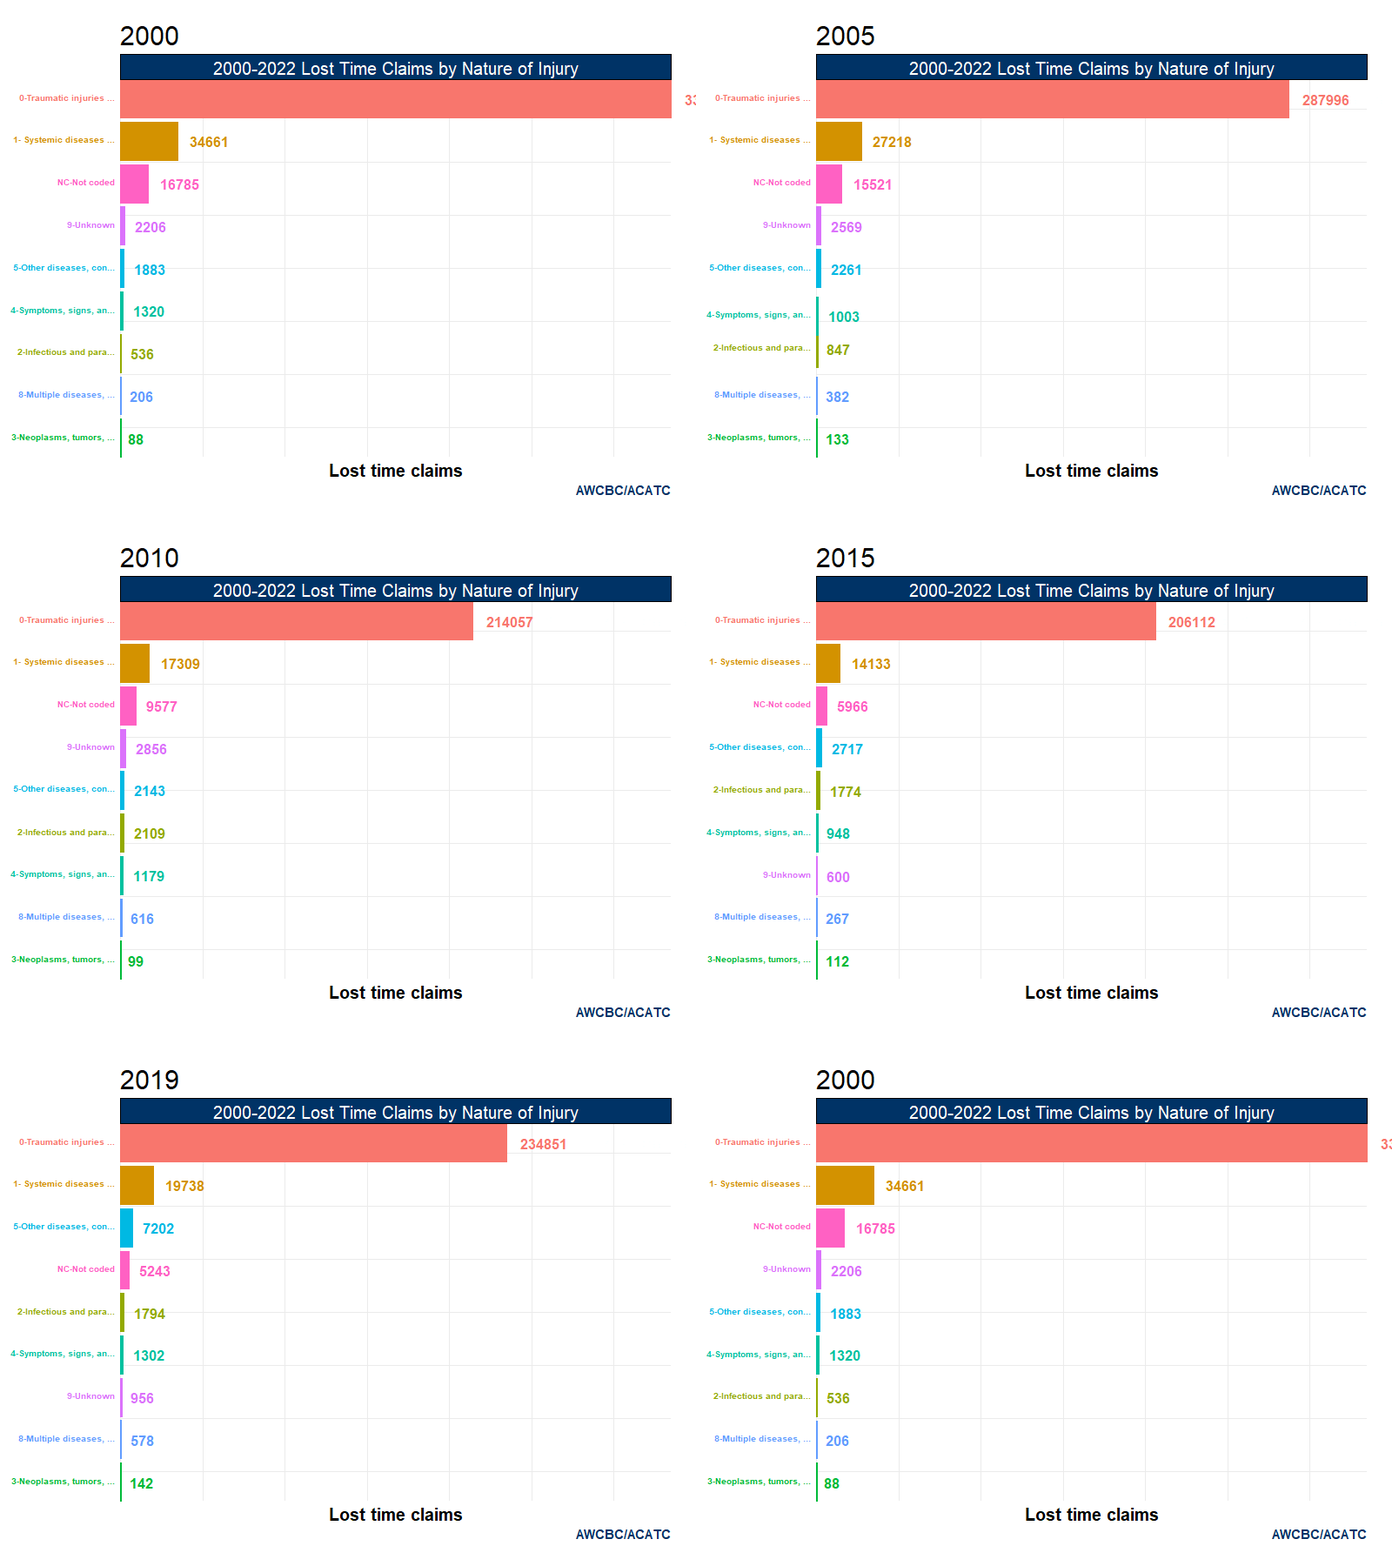
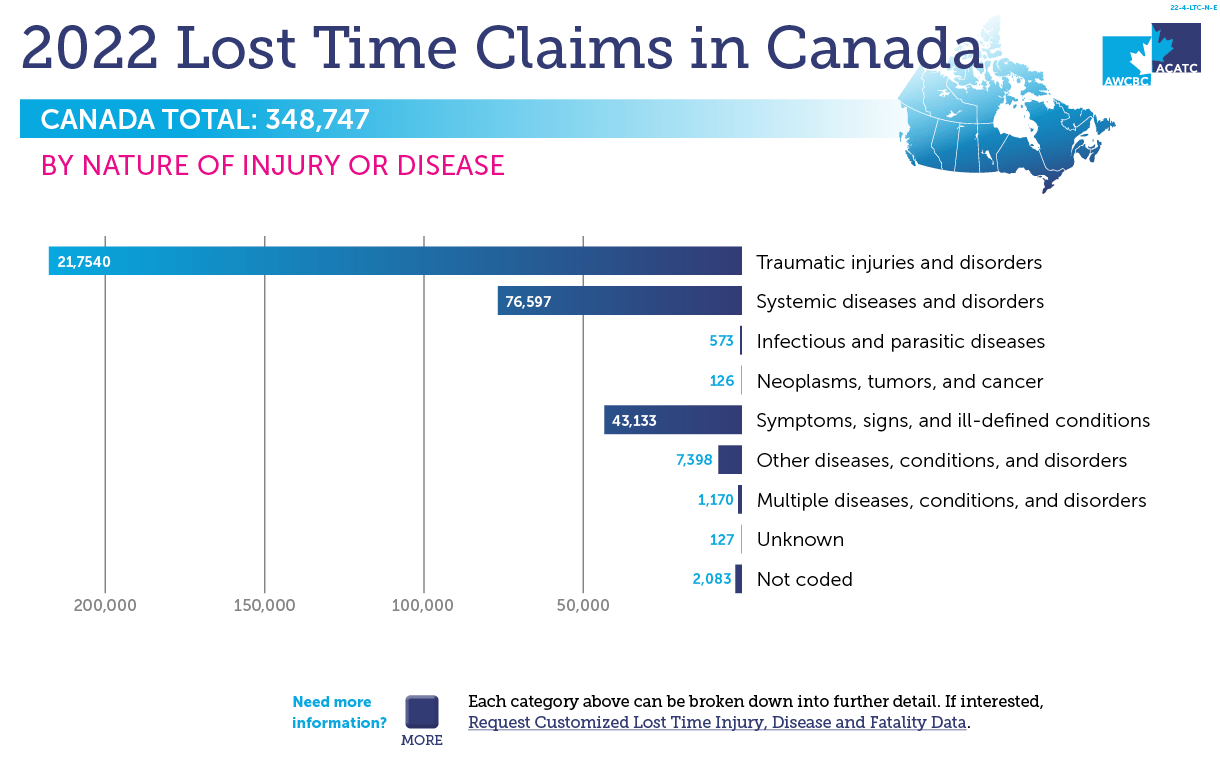
Lost Time Claims, by Nature of Injury – 2000 to 2022
Click here to download Lost Time Claims, by Nature of Injury – 2000 to 2022 Data (xls)
Click here for more Lost Time Claims, by Part of Body – Table #5 (pdf)
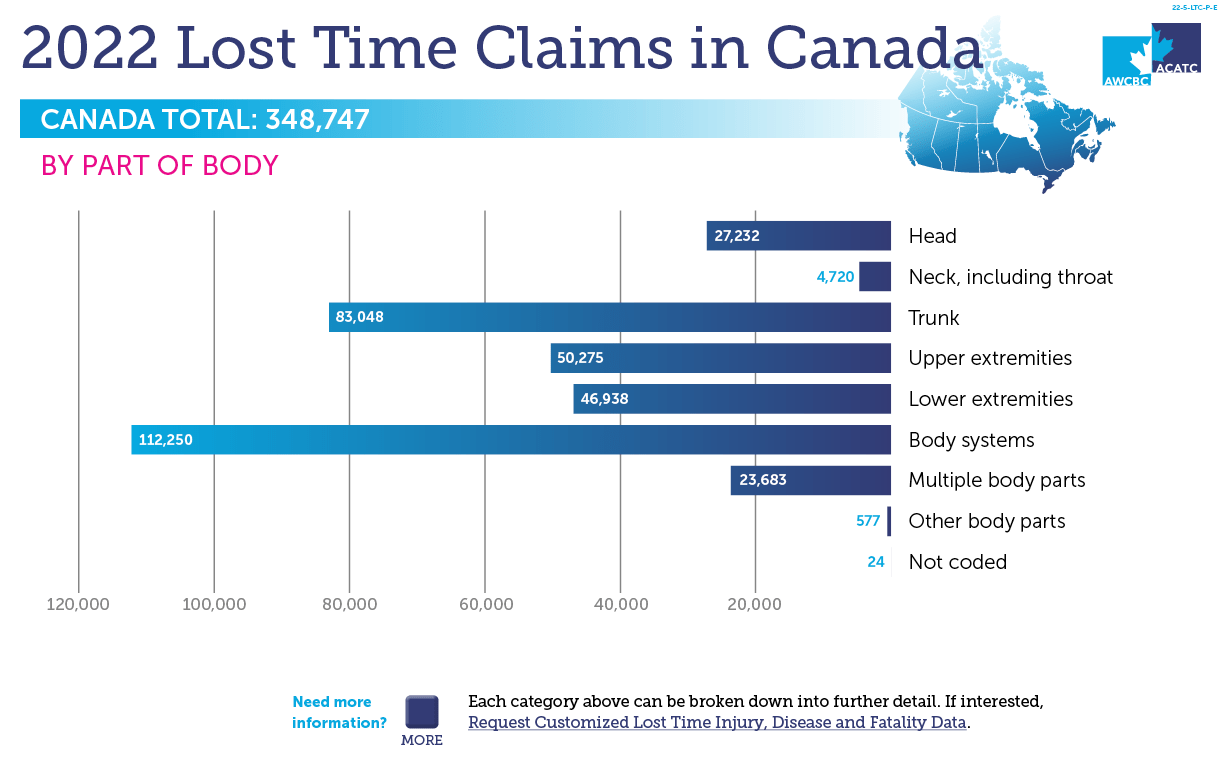
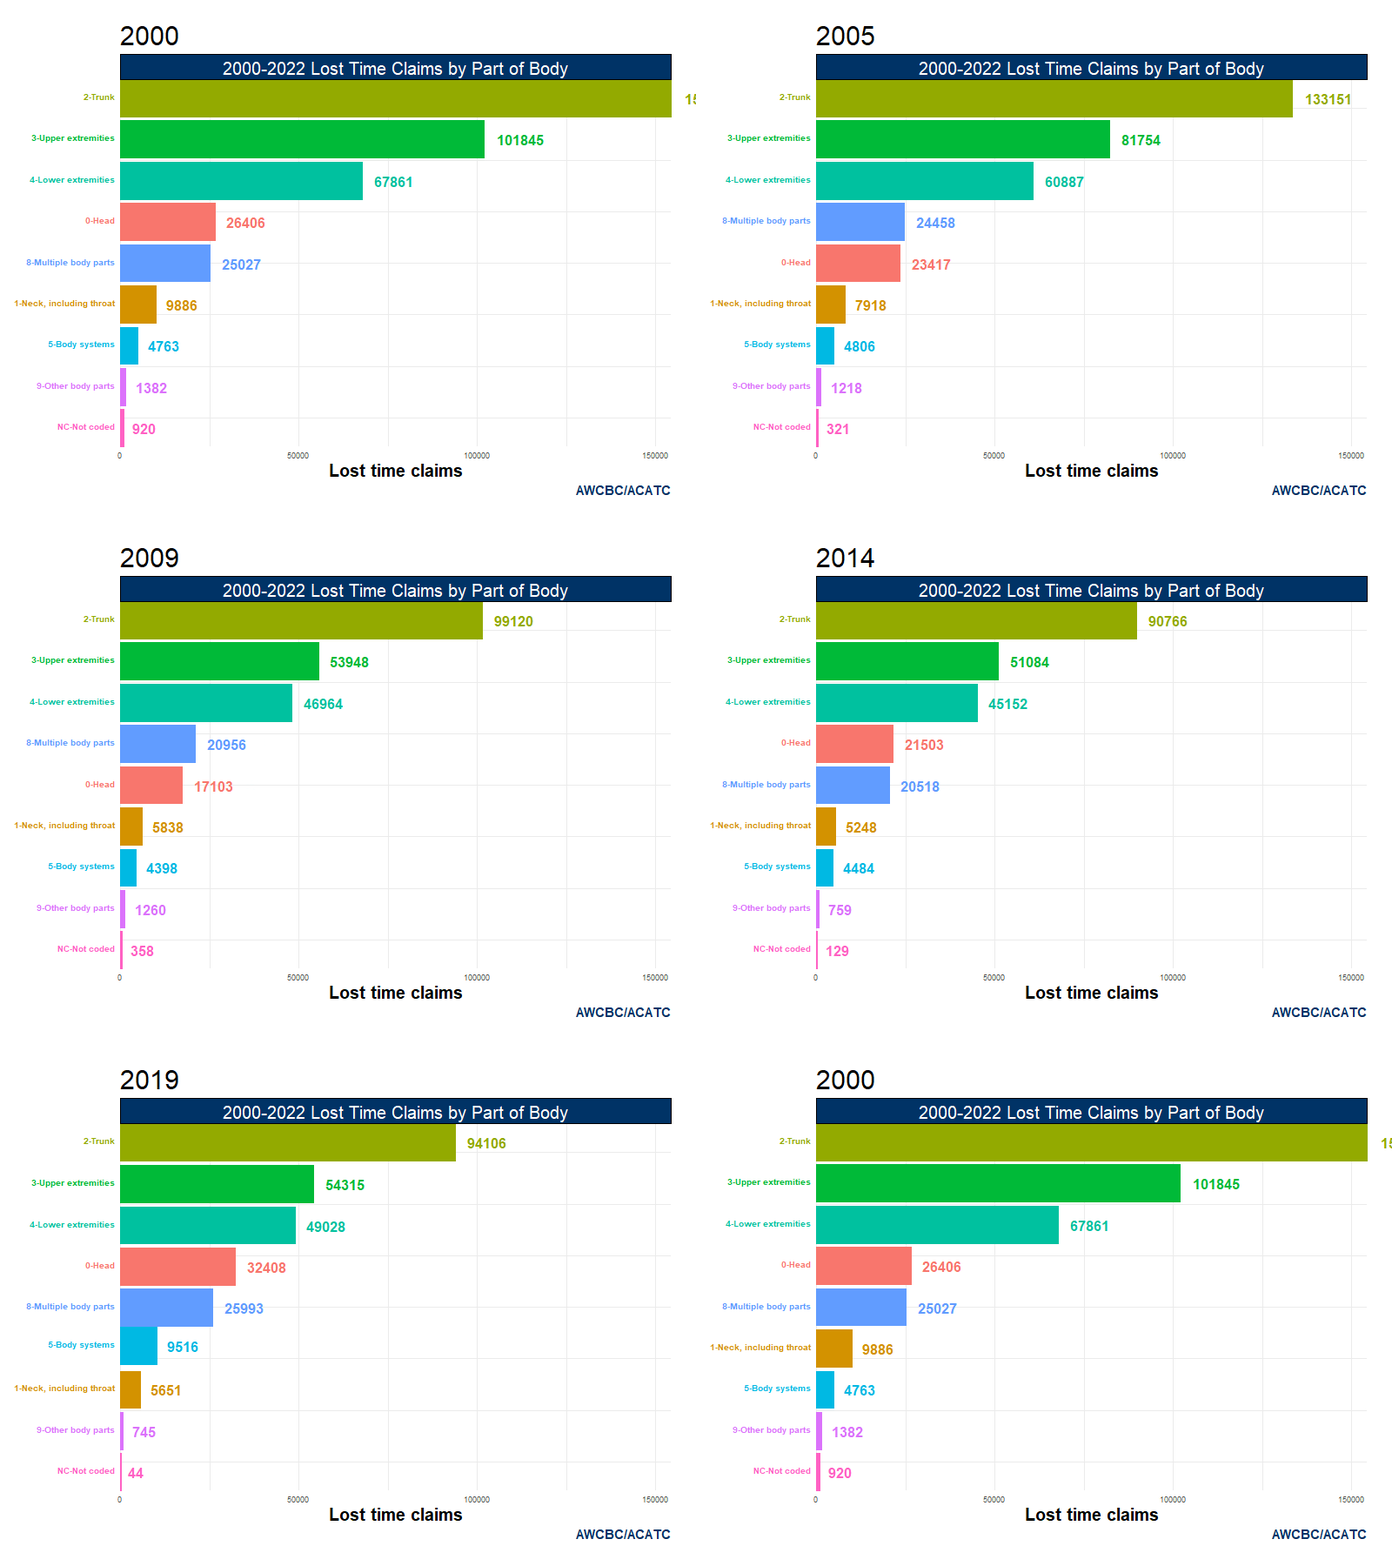
Lost Time Claims, by Part of Body – 2000 to 2022
Click here to download Lost Time Claims, by Part of Body – 2000 to 2022 Data (xls)
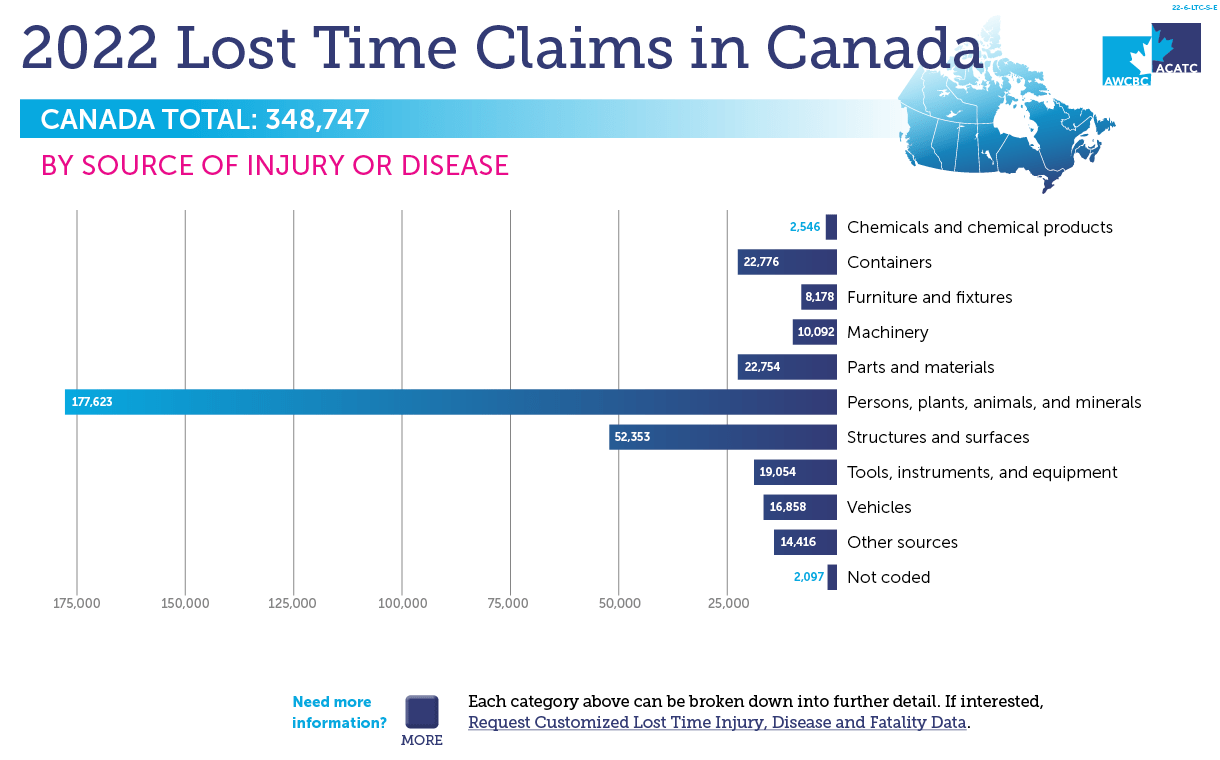
Click here for more Lost Time Claims, by Source of Injury – Table #6 (pdf)
Lost Time Claims, by Source of Injury – 2000 to 2022
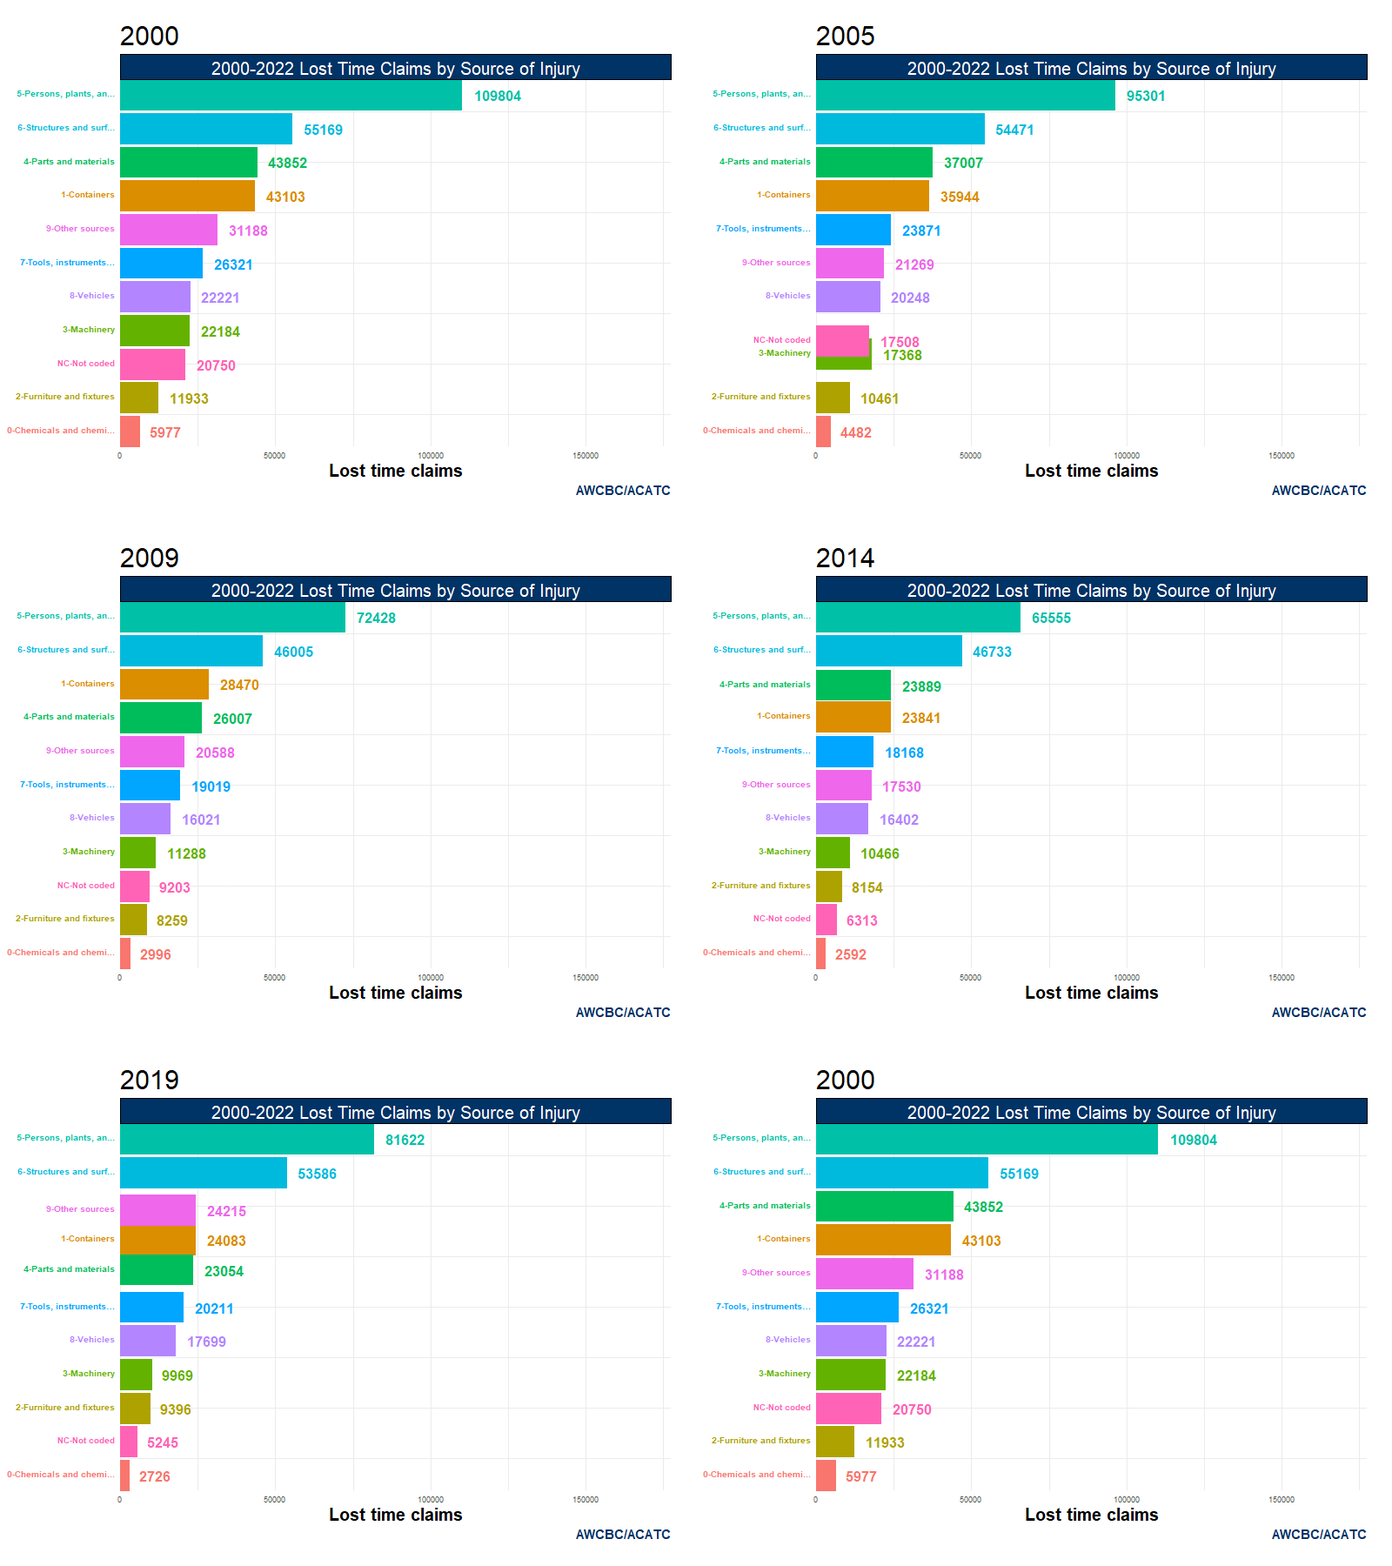
Click here to download Lost Time Claims, by Source of Injury – 2000 to 2022 Data (xls)
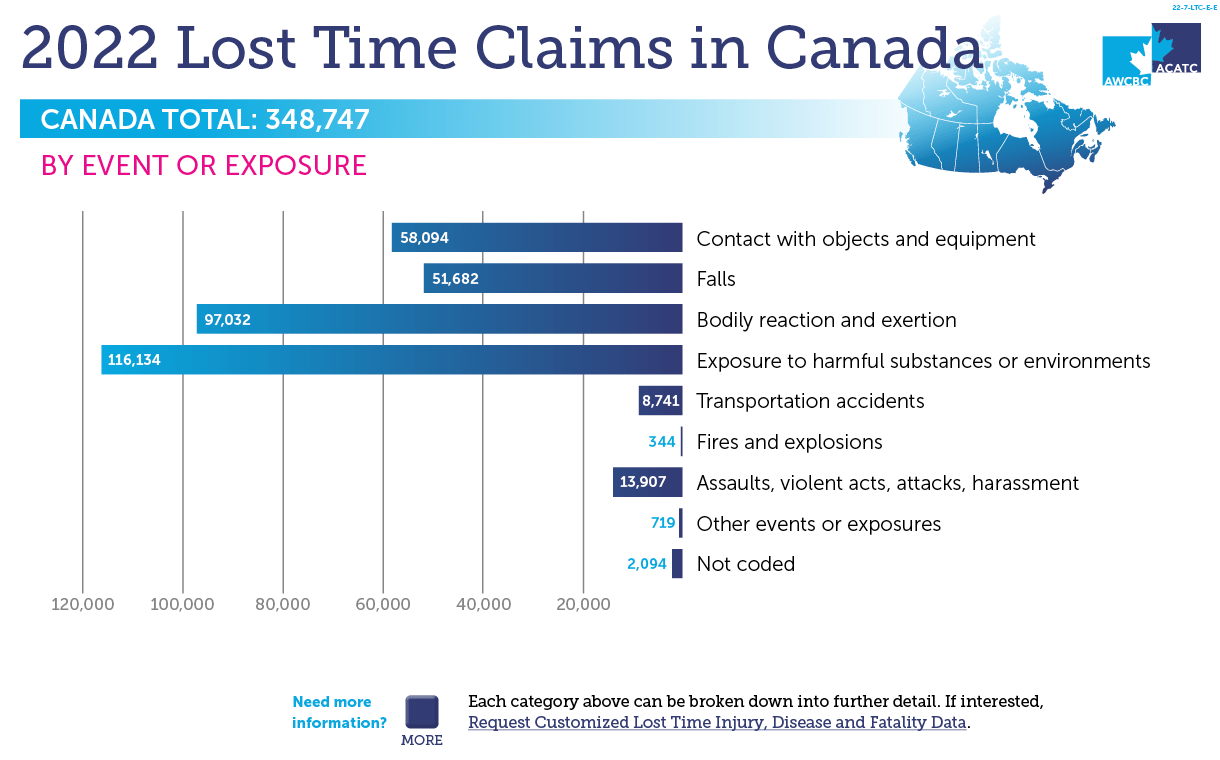
Click here for more Lost Time Claims, by Event – Table #7 (pdf)
Lost Time Claims, by Event – 2000 to 2022
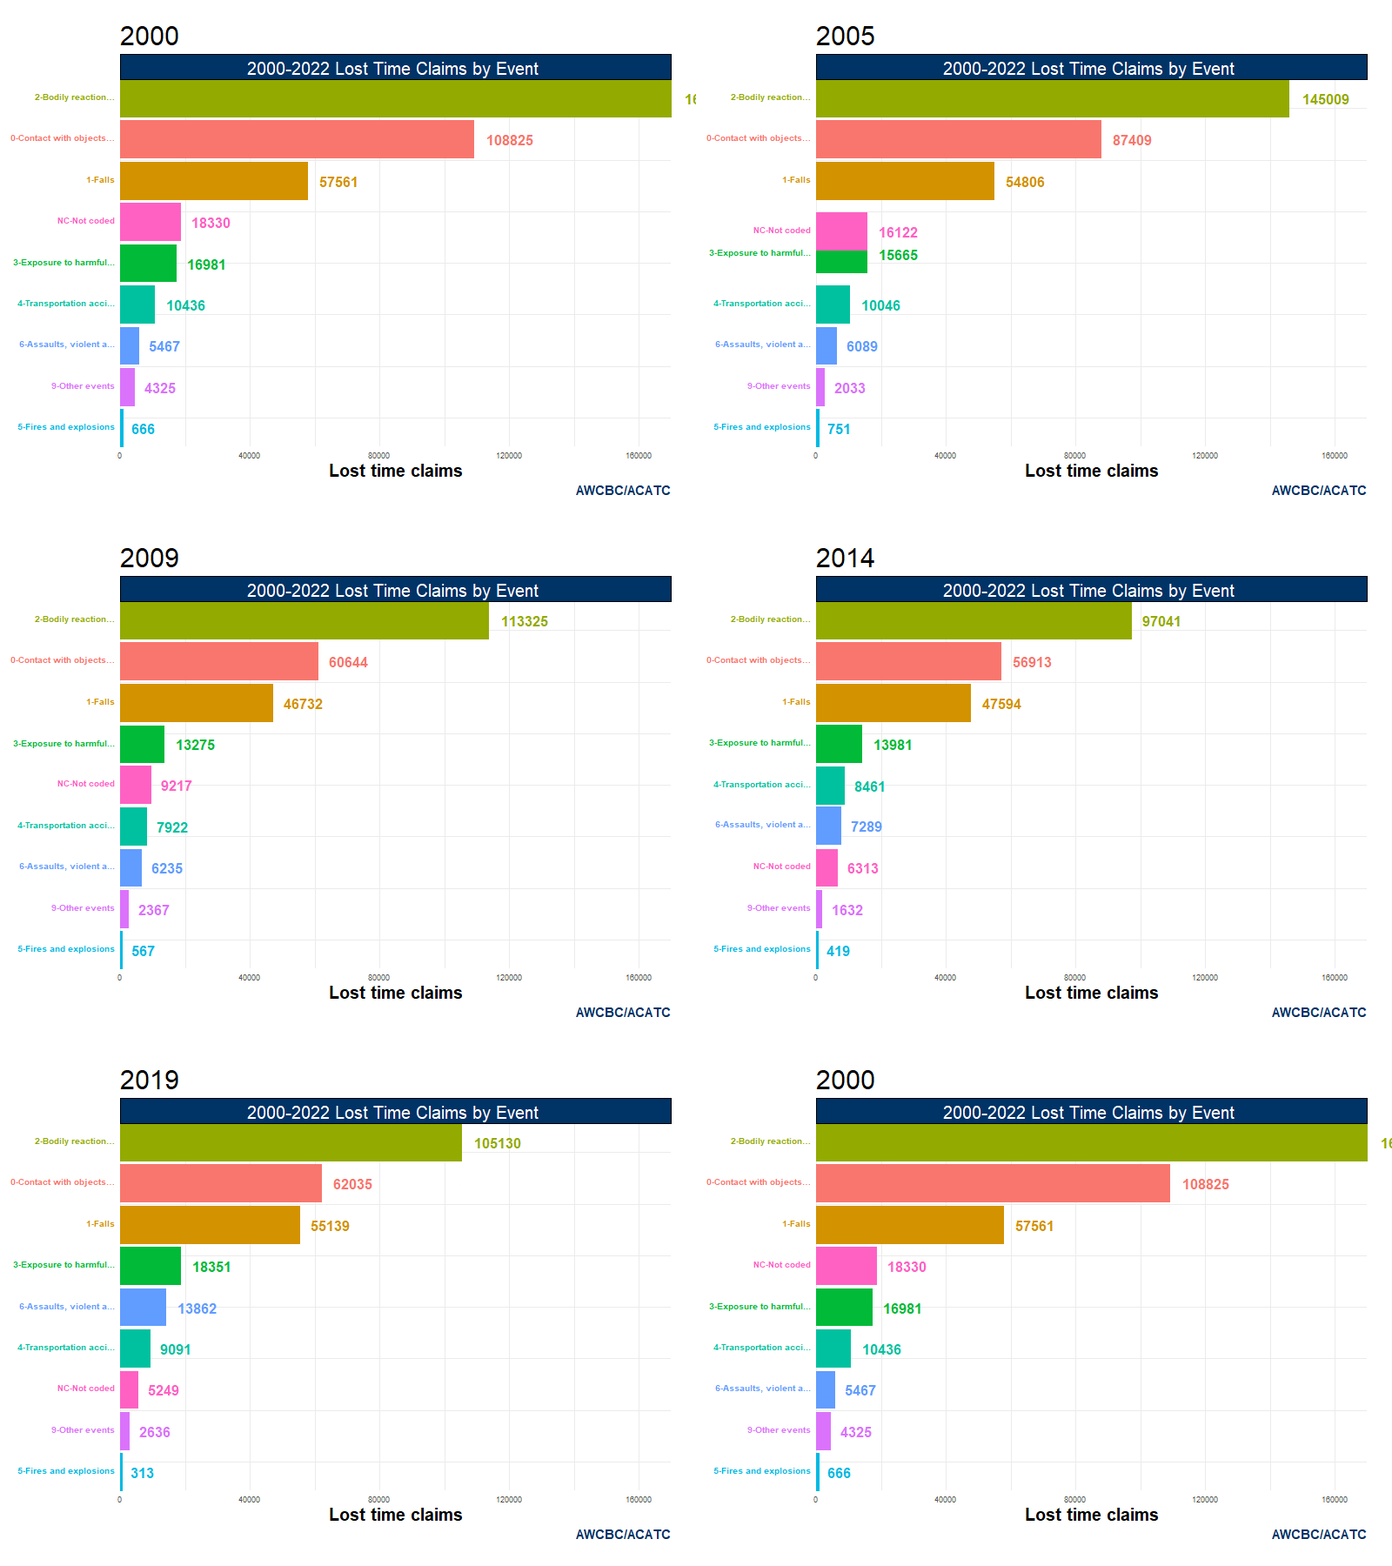
Click here to download Lost Time Claims, by Event – 2000 to 2022 Data (xls)
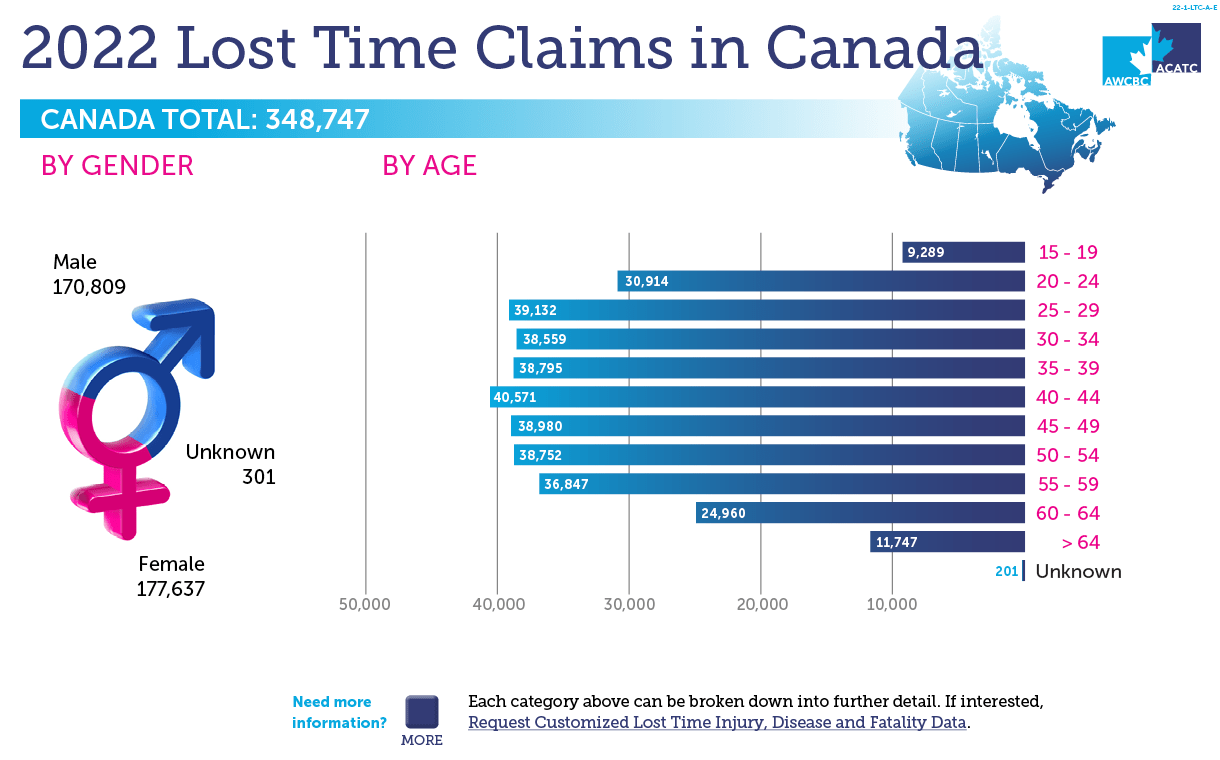
Click here for more Lost Time Claims, by Gender – Table #2 (pdf)
Click here for more Lost Time Claims, by Age – Table #3 (pdf)
Lost Time Claims, by Age – 2000 to 2022
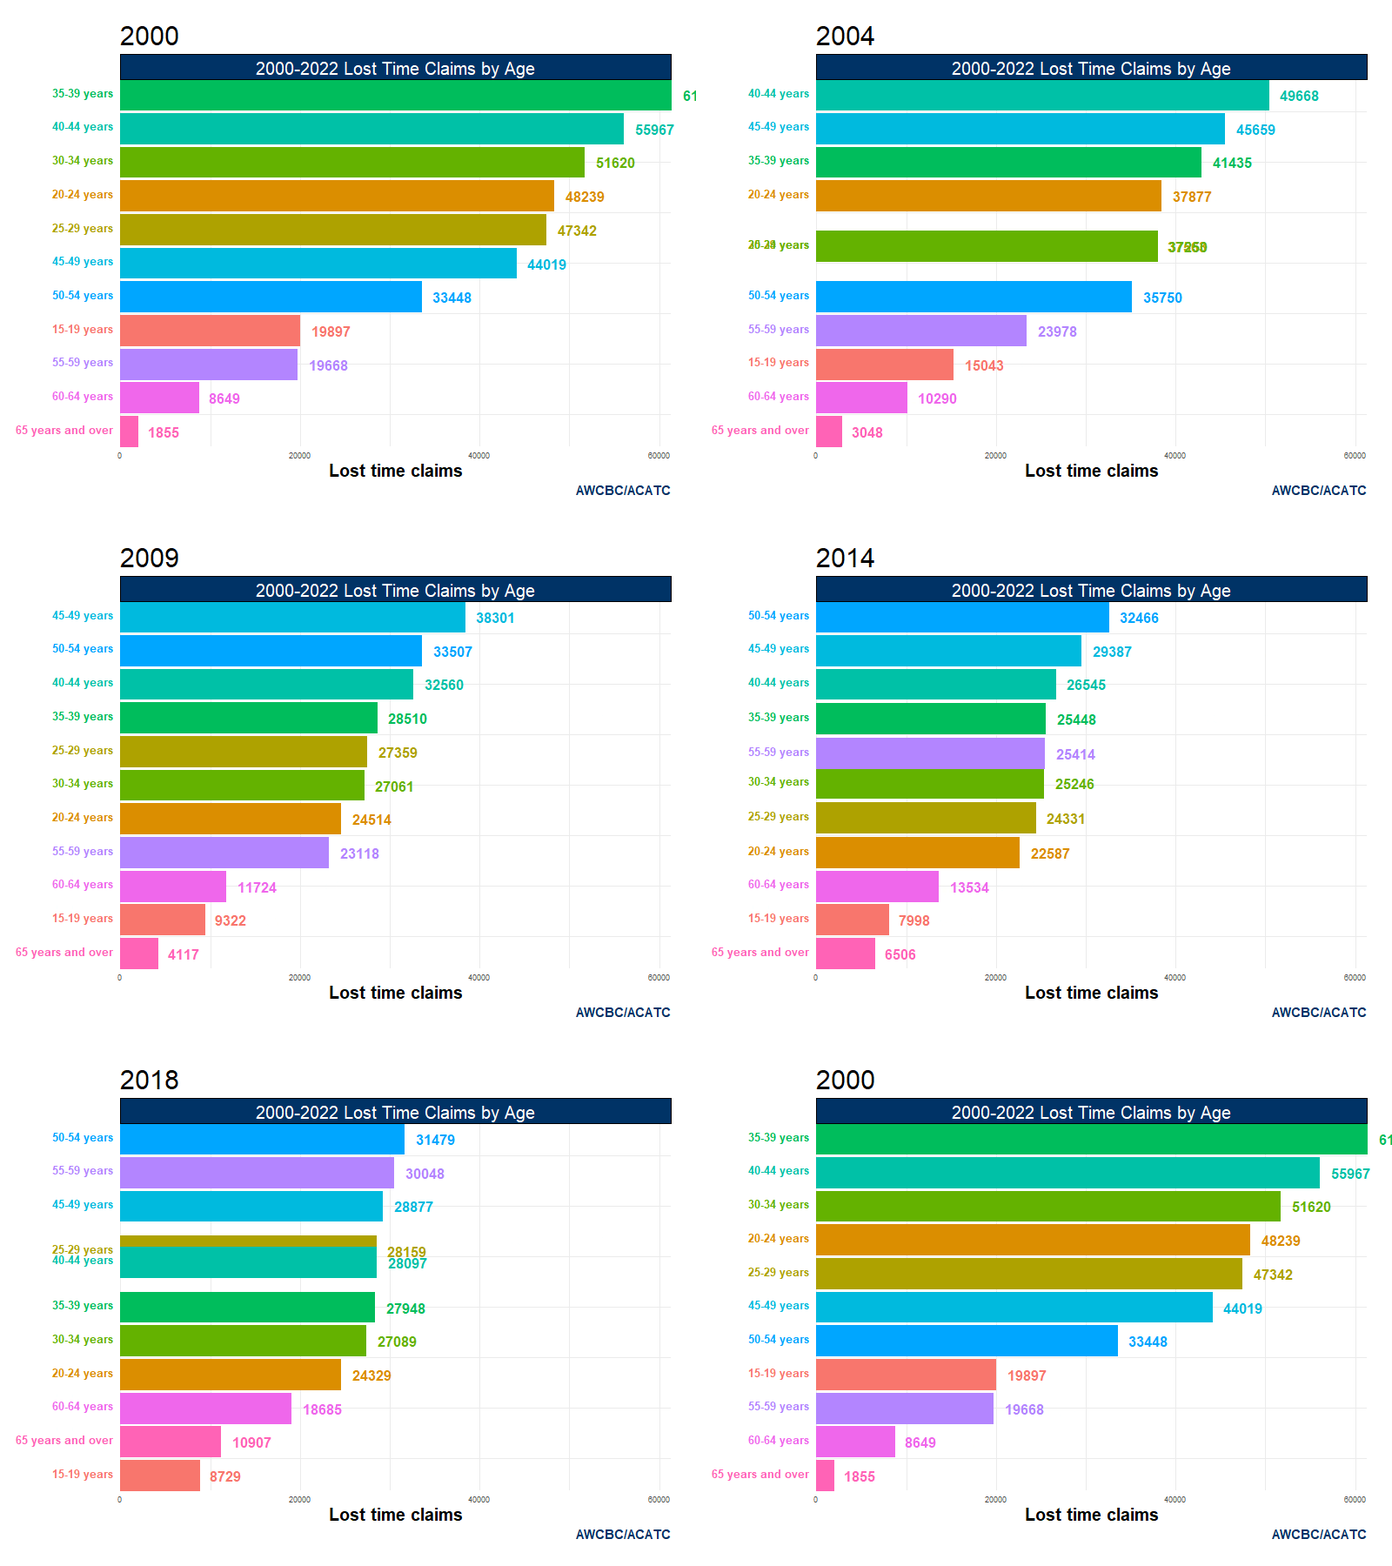
Click here to download Lost Time Claims, by Age – 2000 to 2022 Data (xls)
Click here for more Lost Time Claims, by Jurisdiction – Table #1 (pdf)
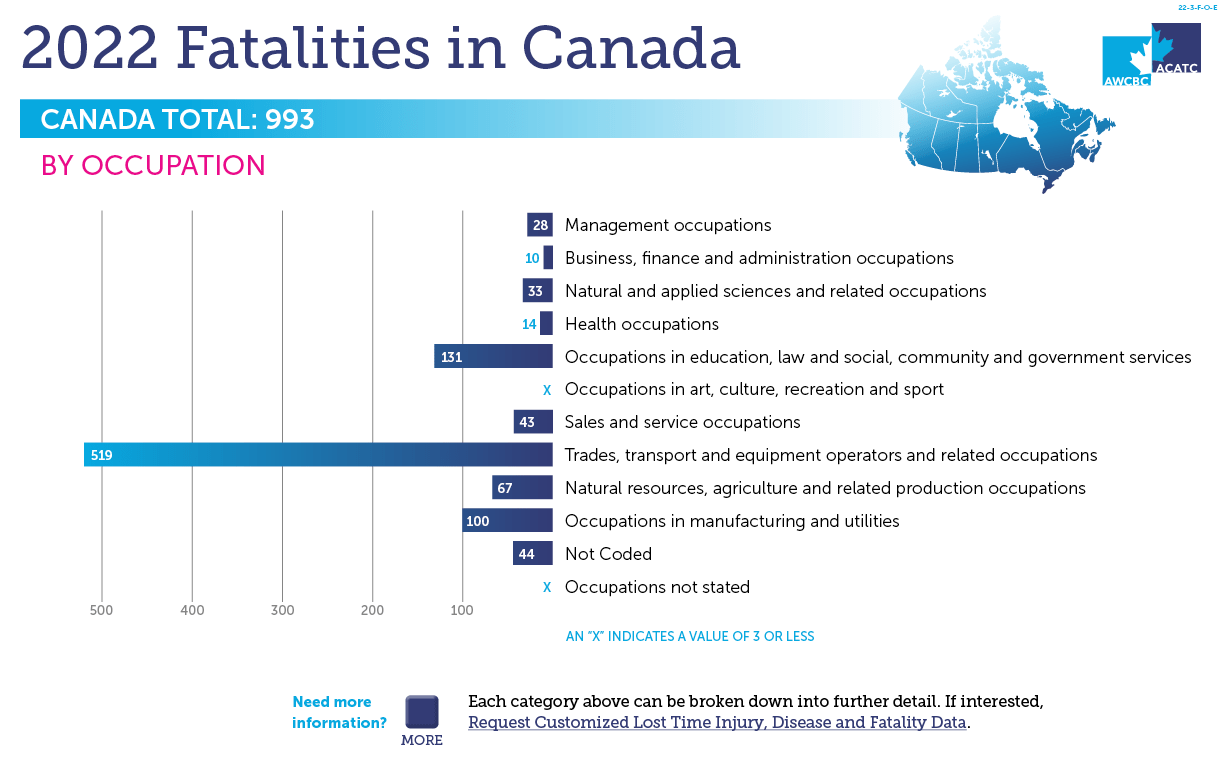
Click here for more Fatalities, by Occupation – Table #29 (pdf)
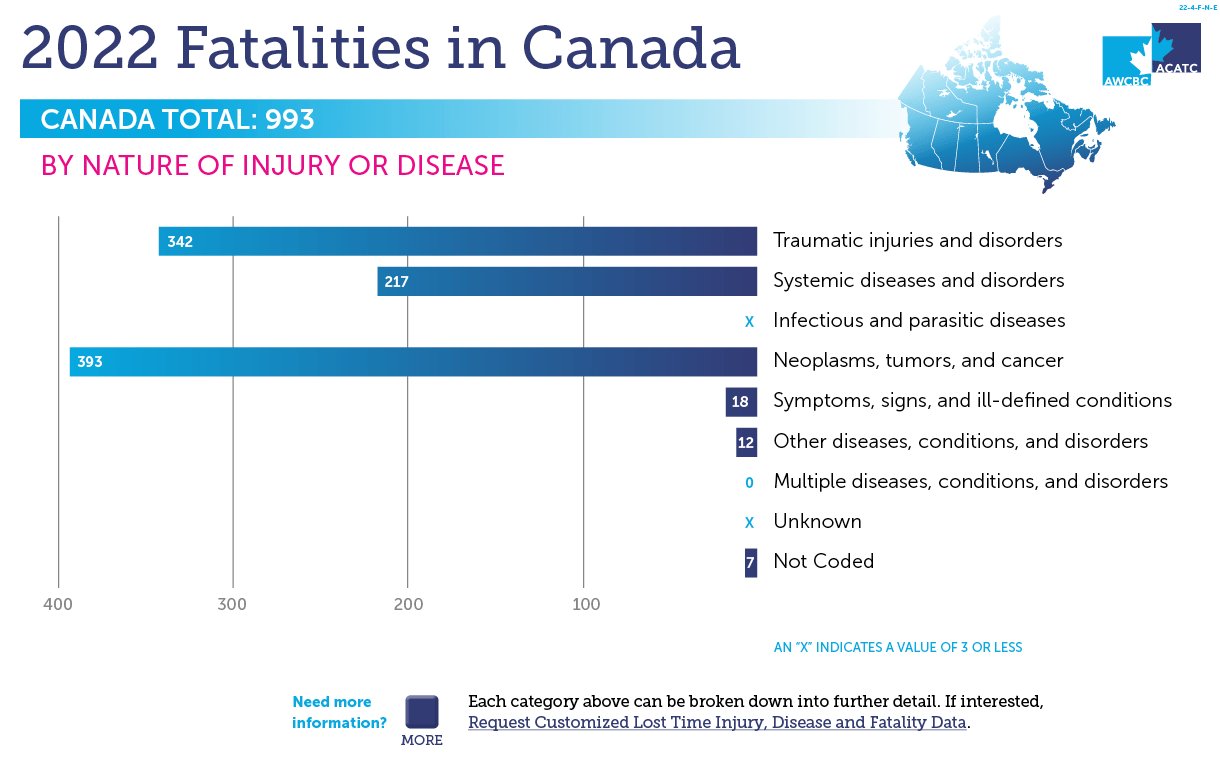
Click here for more Fatalities, by Nature of Injury – Table #25 (pdf)
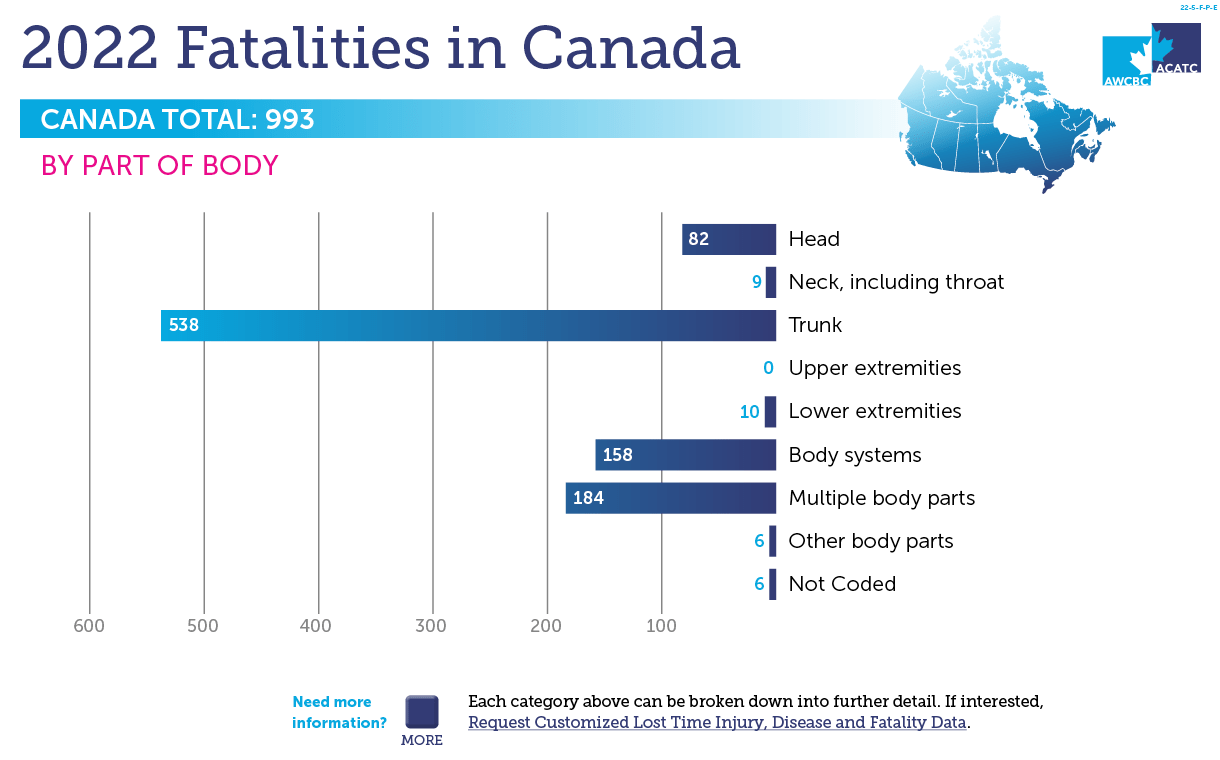
Click here for Fatalities, by Part of Body – Table #26 (pdf)
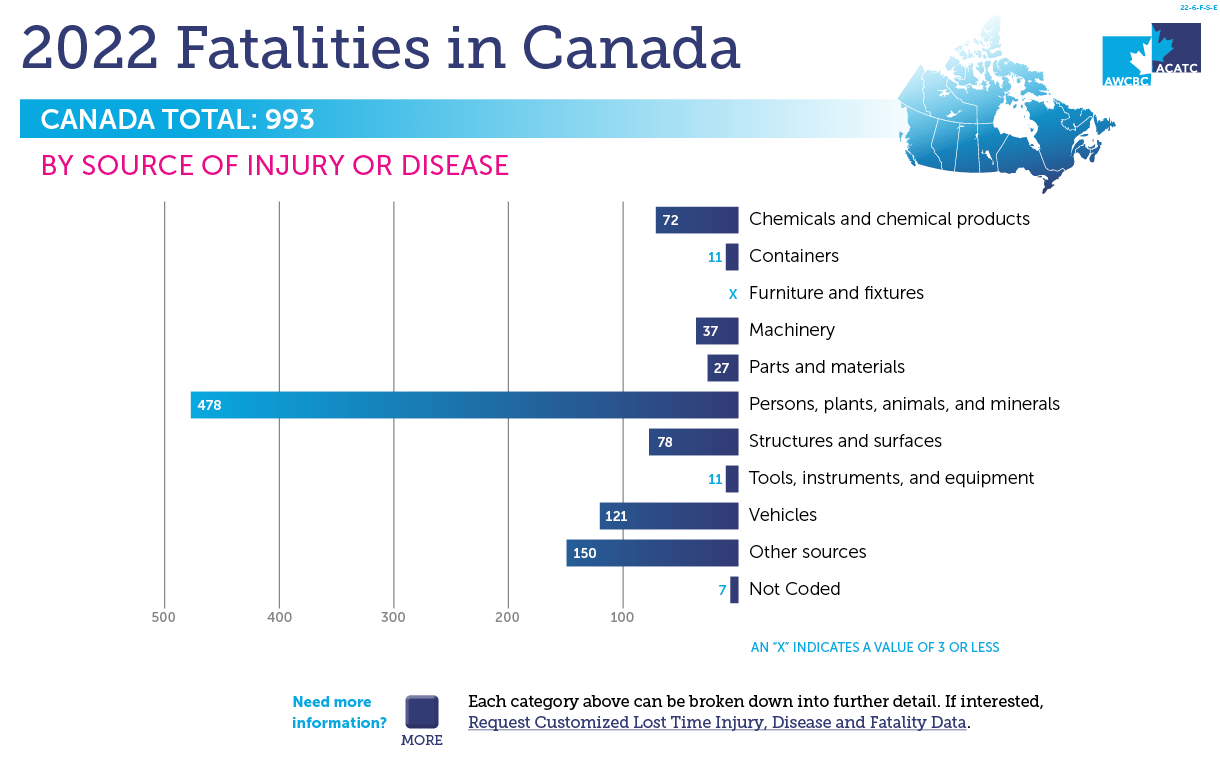
Click here for more Fatalities, by Source of Injury – Table #27 (pdf)
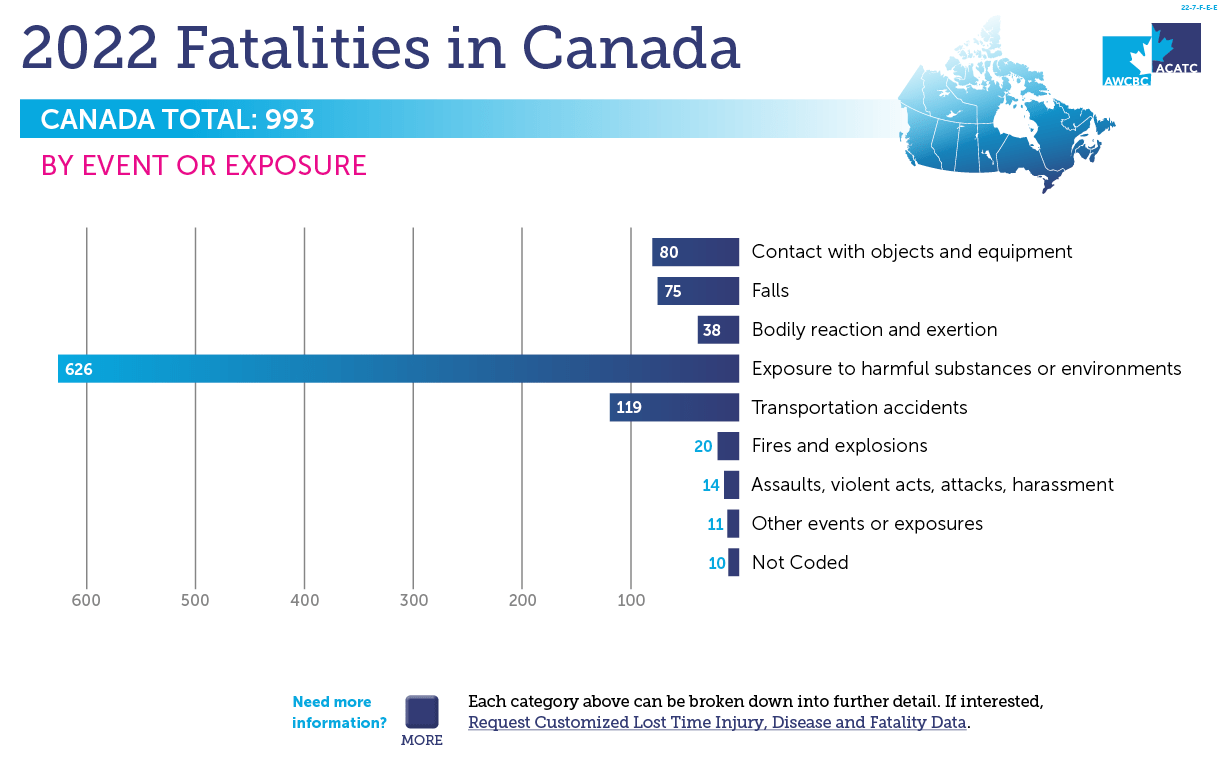
Click here for more Fatalities, by Event – Table #28 (pdf)
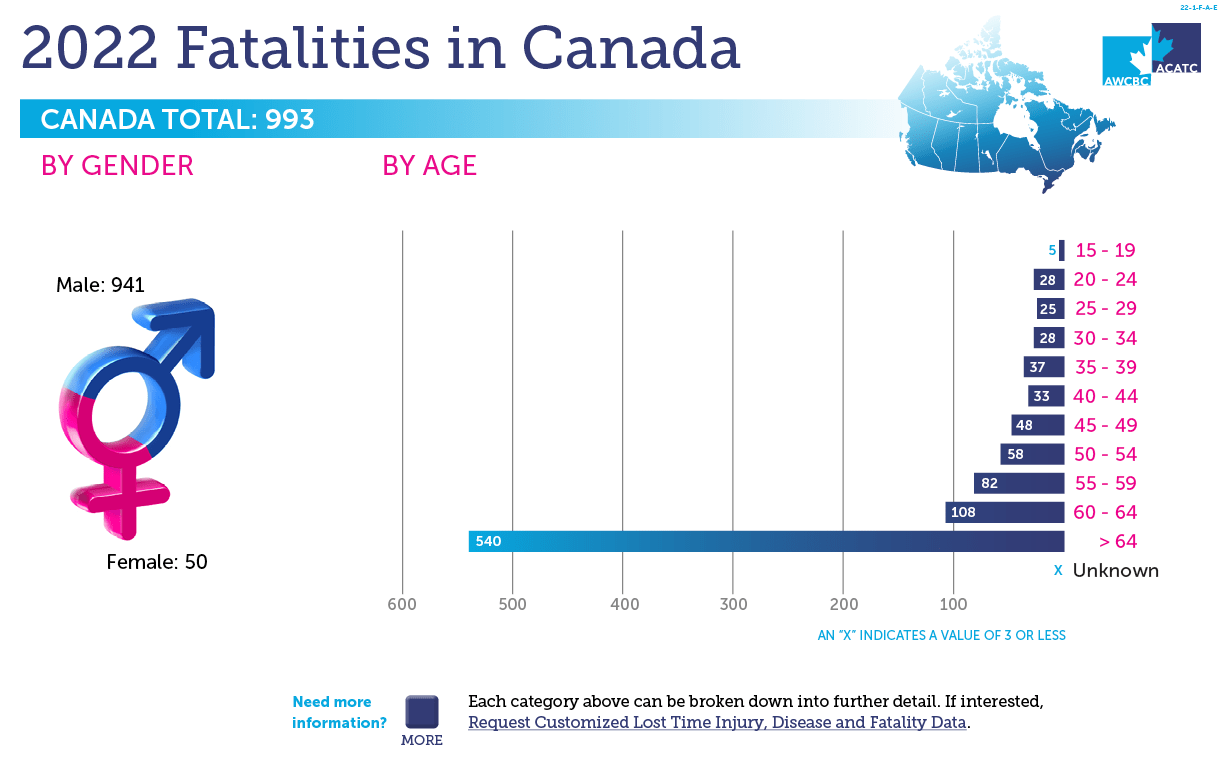
Click here for more Fatalities, by Gender – Table #23 (pdf)
Click here for more Fatalities, by Age – 2019-2021: Page 275 – Table #24 (pdf)
Click here for more Fatalities, by Jurisdiction – Table #22 (pdf)
Key Statistical Measures (KSM)
Detailed financial and statistical indicators documenting everything from injury frequency and timeliness of claim payment to assessment rates and administration costs.
For more information, view Fact Sheet and Resources
